Service Offering for Conglomerates
Unlocking Group, Business Unit & Cross-Business Synergy
through Modus ETP & Value-System Intelligence
Executive Summary
Conglomerates operate across multiple industries, brands and business models. That diversity creates enormous opportunity — and structural complexity. Our offering helps conglomerates convert that complexity into sustained advantage by delivering a single, enterprise-grade transformation operating system: the Modus Enterprise Transformation Platform (ETP) combined with a Value-System way of thinking and an AI-driven intelligence layer.
The result: aligned strategy, fewer silos, repeatable transformation, centralized knowledge and measurable cross-business value.
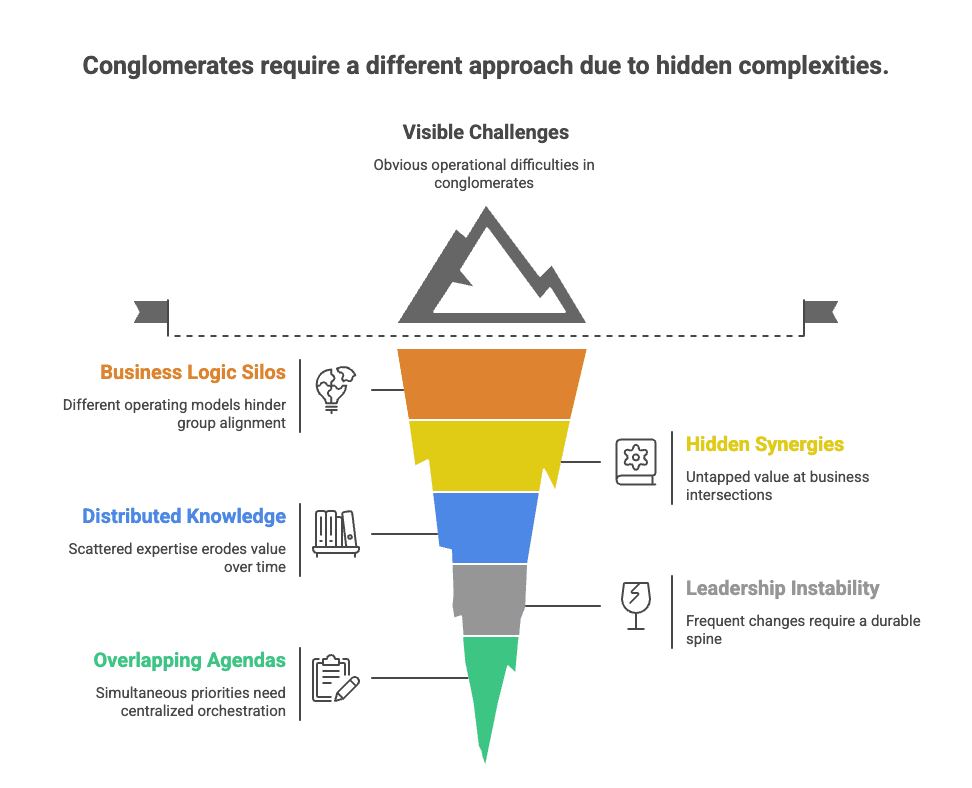
Core Thinking: Why Conglomerates Need a Different Approach
Multiple business logics
Energy, logistics, retail, real-estate, digital and manufacturing all have different operating models yet must align to a single Group ambition.
Hidden synergies
Real value often lives at the intersections — shared customers, suppliers, data, platforms and facilities — which are invisible without a system-level view.
Distributed knowledge
Expertise, processes and tacit knowledge are scattered across BUs and people; without centralization, acquisitions, leadership change and turnover erode value.
Leadership churn & program overload
Frequent leadership changes and many concurrent transformation agendas require a durable, digital operating spine that outlasts individual leaders.
Simultaneous agendas
Digitization, ESG, cost optimisation, new business models and customer experience must be managed together — only a centralized platform can orchestrate them.
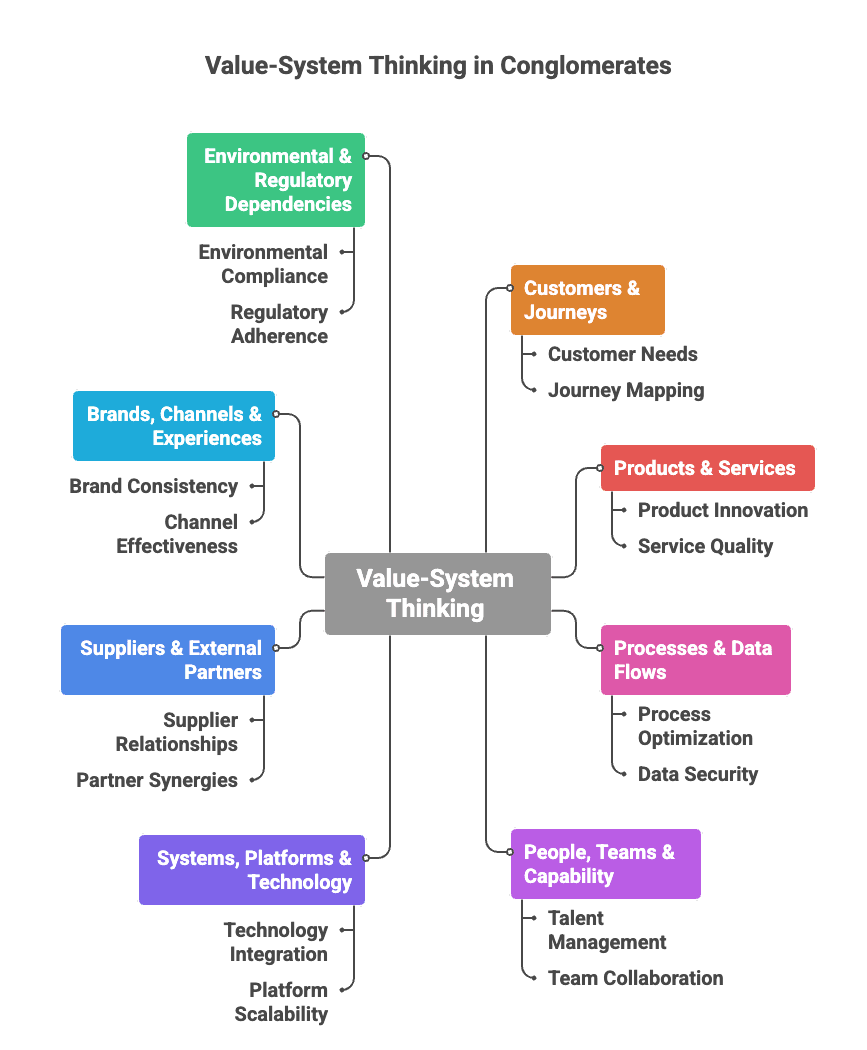
The Value-System Lens
What it is and why it matters
Value-System Thinking views the conglomerate as an interconnected ecosystem of:
Why it matters
— all of which cannot be seen from single-BU views.
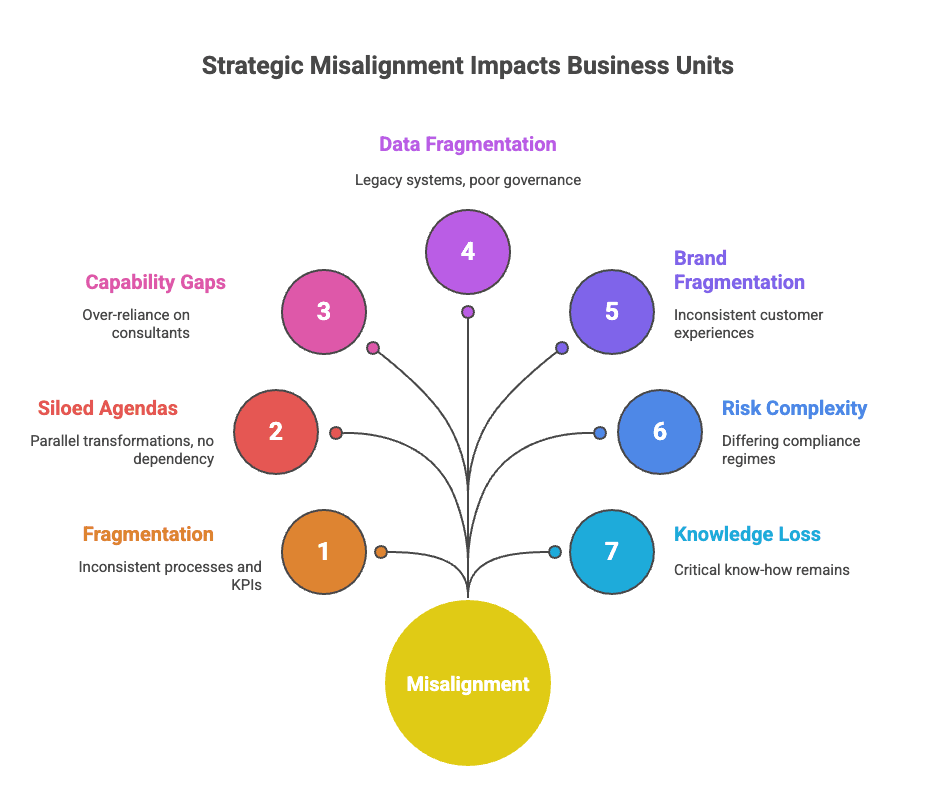
Key Challenges We Solve
Strategic misalignment
Group strategy fails to cascade into BU plans and projects.
Fragmented operating models
Inconsistent processes, KPIs and governance across BUs.
Siloed transformations
Parallel agendas with no cross-business dependency mapping.
Capability gaps
Over-reliance on external consultants and inconsistent change skills.
Technology & data fragmentation
Legacy systems, poor data governance, hard integrations.
Brand & customer fragmentation
Inconsistent experiences across brands and services.
Risk & governance complexity
Differing compliance regimes and no unified oversight.
Knowledge loss
Critical know-how remains in people and ad-hoc artifacts.
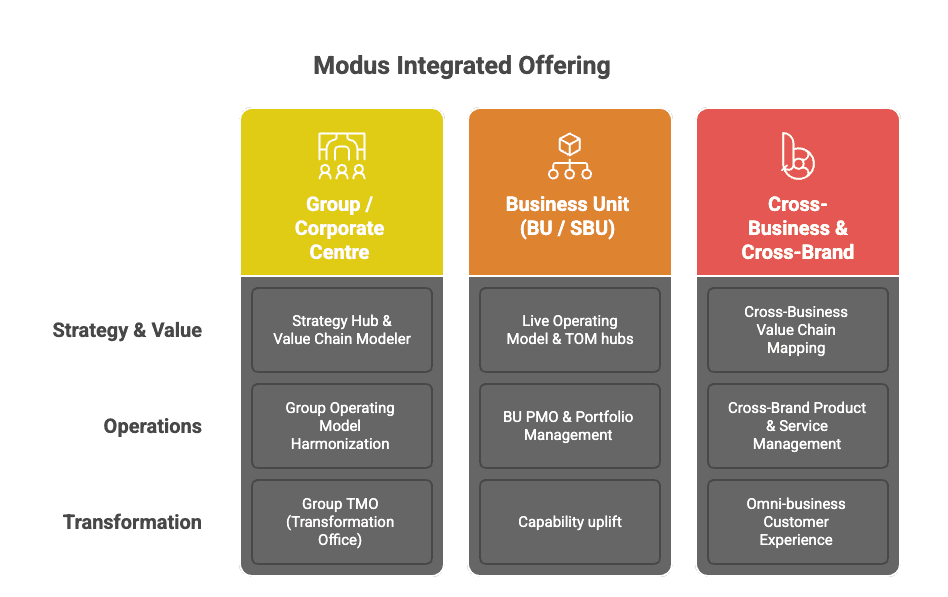
How Modus Solves It
The Integrated Offering
A. Group / Corporate Centre
Strategy Hub & Value Chain Modeler
Digitize Group strategy and generate executable roadmaps that cascade to SBUs.
Group Operating Model Harmonization
Shared process standards, common KPIs and reusable assets while preserving BU autonomy.
Group TMO (Transformation Office)
Central governance, risk & portfolio visibility and Transformation-as-Usual (TAU) enablement.
B. Business Unit (BU / SBU)
Live Operating Model & TOM hubs
Capture, digitize and maintain BU processes, systems, roles, KPIs and customer journeys.
BU PMO & Portfolio Management
Project templates, dashboards, stage-gates, and benefits tracking (agile + waterfall).
Capability uplift
Role-based training, delivery templates and the Modus Transformation Buddy to reduce consultant dependency.
C. Cross-Business & Cross-Brand
Cross-Business Value Chain Mapping
Reveal shared supply chains, customer journeys, platforms and workforce to unlock synergy pools.
Cross-Brand Product & Service Management
Centralized governance for product architecture, marketing, and unified experience design.
Omni-business Customer Experience
Build seamless journeys across brands/services and enable cross-selling and loyalty programs.
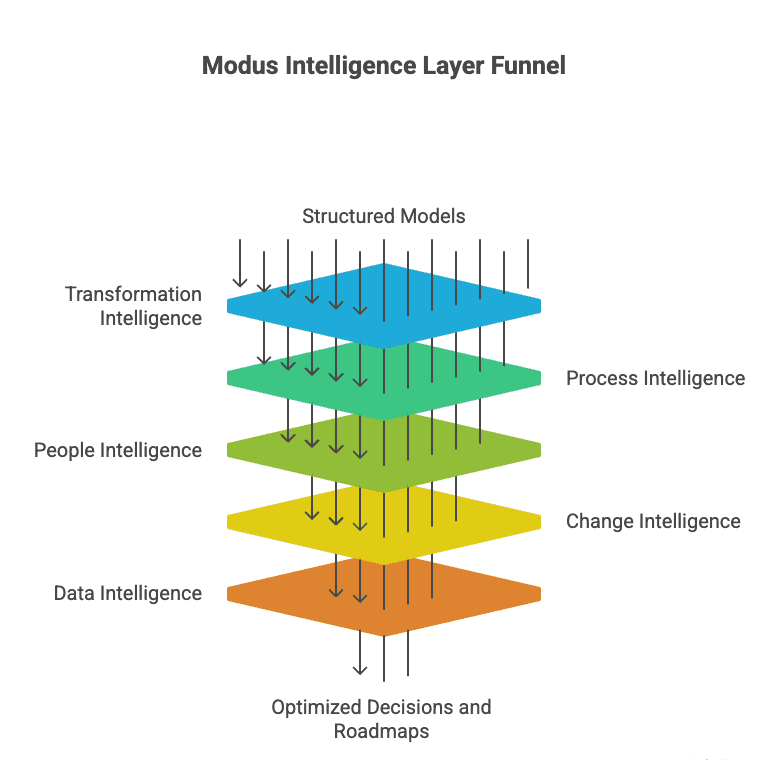
The Intelligence Layer
Transformation AI & Intelligence Types
Modus combines structured models with an intelligence layer to make change predictable:
Transformation Intelligence
Scenario modelling, roadmap comparison, risk / benefit trade-offs and "what-if" planning.
Process Intelligence
Automated discovery of bottlenecks, non-value activities, and automation candidates.
People Intelligence
Adoption risk scoring, capability gap analytics, readiness and change saturation forecasting.
Change Intelligence
Predicts resistance zones, optimal communication levers, and tailors OCM interventions.
Data Intelligence
Master data alignment, cross-BU analytics and single source of truth for decisioning.
Outcome: decisions are evidence driven, roadmaps are optimised, and in-flight changes are proactively managed.
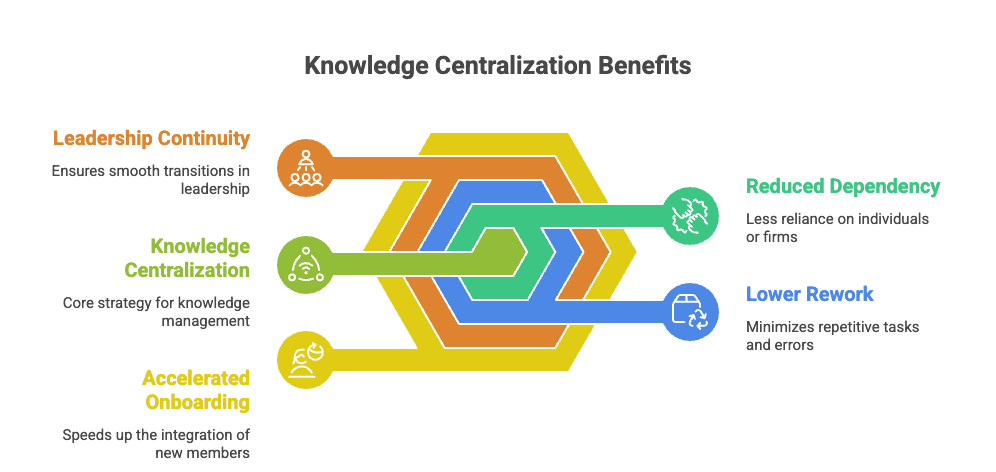
Knowledge Centralization
The single most critical enabler
A Central Knowledge Hub captures and governs:
Why this matters
Centralization delivers tangible benefits:
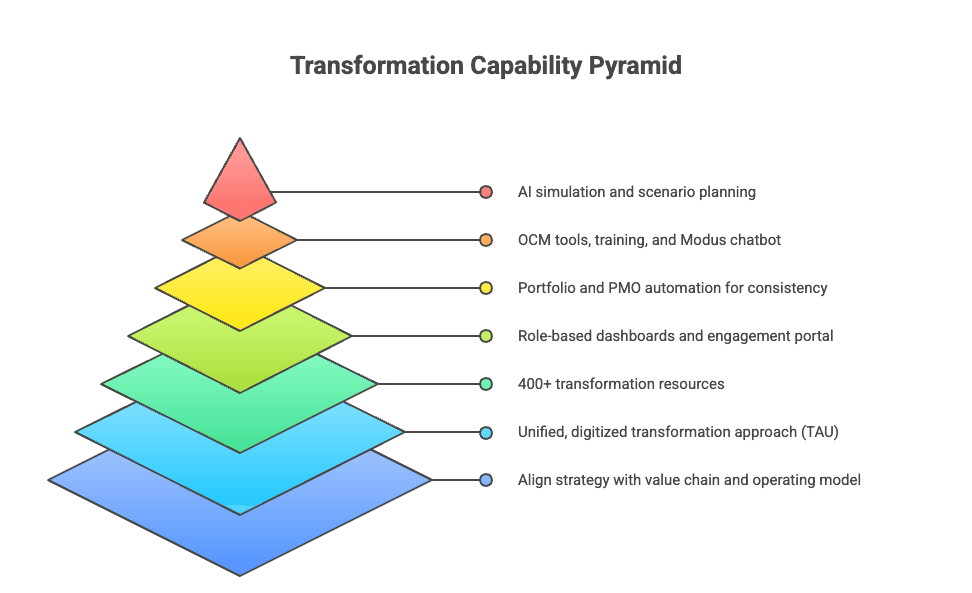
Core Capabilities & Accelerators
Strategy → Value Chain → Operating Model integration
A unified, digitized transformation methodology (TAU)
400+ reusable transformation assets (value chains, templates, logs)
Role-based dashboards & engagement portal for every user type
Portfolio & PMO automation for consistent governance
OCM tools, training frameworks and the Modus chatbot for adoption
AI simulation & scenario planning for confident decisioning
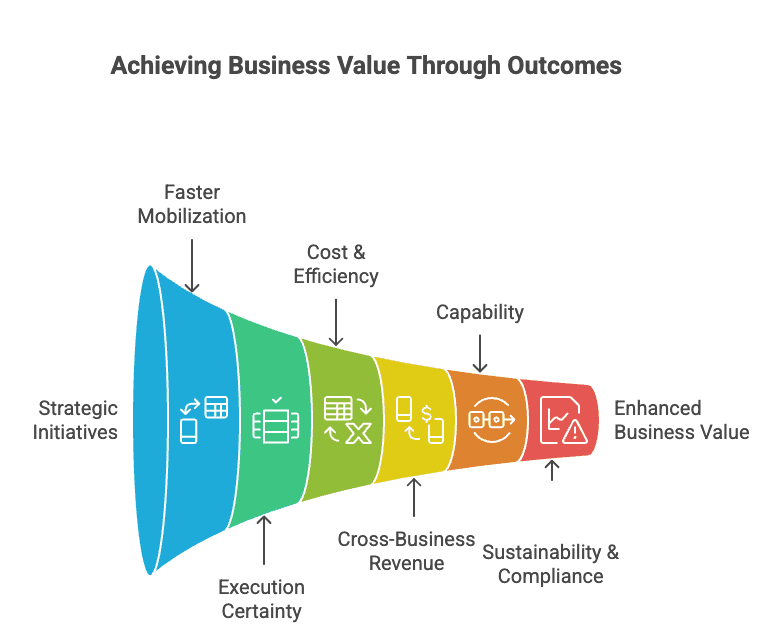
Measurable Outcomes & Business Value
Faster mobilization
reduction in time to launch programs
Execution certainty
fewer benefit leaks and more predictable deliveries
Cost & efficiency
elimination of duplicated functions and optimized shared services
Cross-business revenue
unlocked cross-sell and bundled offers from unified customer views
Capability
reduced external dependency, internal PMO maturity and leadership continuity
Sustainability & compliance
integrated ESG and risk reporting across portfolios
(Exact ROI modelling is provided as a follow-on deliverable tailored to the conglomerate's footprint and portfolio.)
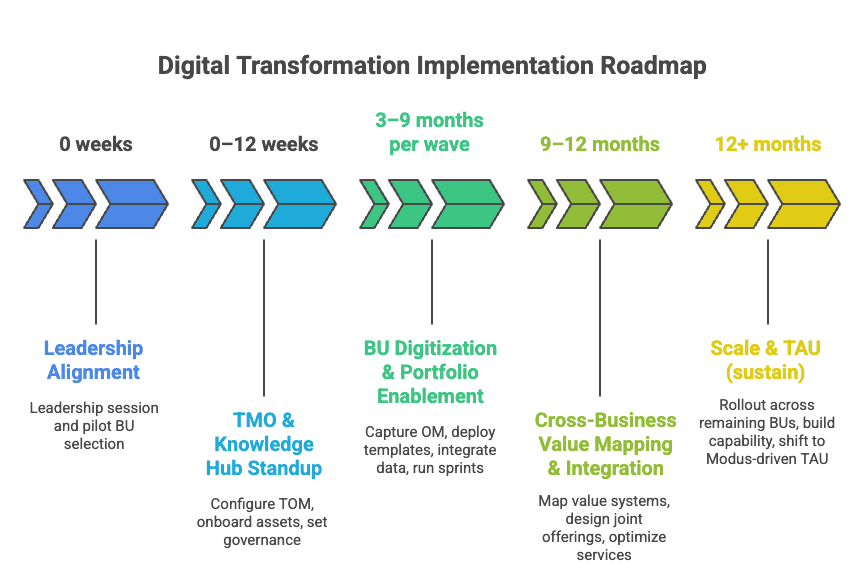
Implementation Approach
Phased, Low-Risk
Leadership Alignment & Pilot Design
Leadership session, selection of 1–2 anchor BUs for pilot, success metrics defined.
TMO & Knowledge Hub Standup
0–12 weeks
Configure Group TOM, onboarding of strategic assets, set governance and KPIs.
BU Digitization & Portfolio Enablement
3–9 months per wave
Capture Live OM for selected BUs, deploy PMO templates, integrate core data sources, run first transformation sprints.
Cross-Business Value Mapping & Integration
Map cross-BU value systems, design joint offerings, optimize shared services.
Scale & TAU (sustain)
Rollout across remaining BUs, build internal capability, shift to Modus-driven TAU with continuous improvement and AI insights.
Final Positioning
This offering creates an integrated, future-ready transformation ecosystem: a Value-System view + centralized knowledge + AI intelligence + a digital TMO.
It enables conglomerates to unify strategy, synchronize business units, unlock cross-portfolio value and sustain transformation as an everyday competency.
.png)